|
2000 |
2001 |
2002 |
2003 |
2004 |
2005 |
|
|
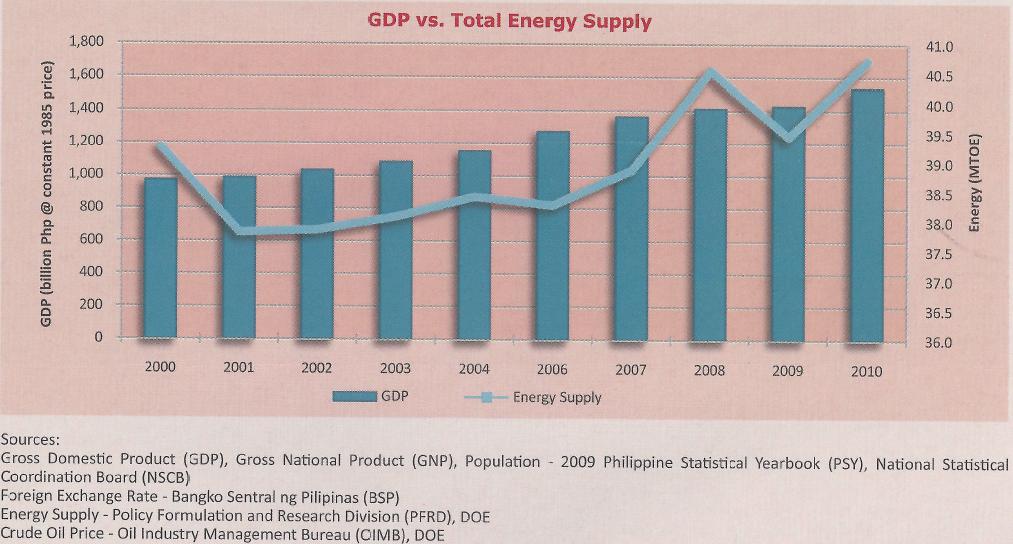
GDP (in billion pesos: at constant 1985 prices) |
973 |
990 |
1034.1 |
1085.1 |
1154.3 |
1211.5 |
|
GNP (in billion pesos: at constant 1985 prices) |
1037.9 |
1061.3 |
1105.7 |
1171.4 |
1252.3 |
1320 |
|
Energy Consumption (in MTOE) |
23.9 |
23.7 |
23.6 |
23.9 |
24.1 |
23.4 |
|
Energy Supply (in MTOE) |
39.3 |
37.8 |
37.9 |
38.1 |
38.4 |
38.5 |
|
Population (in million) |
76.9 |
78.6 |
80.2 |
81.9 |
83.6 |
85.3 |
|
Forex (in Pesos/USD) |
44.2 |
51 |
51.6 |
54.2 |
56 |
55.1 |
|
Average Crude Price (in USD/Barrel) |
26.2 |
22.8 |
23.8 |
26.8 |
33.6 |
49.3 |
|
|
2006 |
2007 |
2008 |
2009 |
2010 |
AAGR* |
|
GDP (in billion pesos: at constant 1985 prices) |
1276.2 |
1366.6 |
1417.1 |
1432.1 |
1537.2 |
4.7% |
|
GNP (in billion pesos: at constant 1985 prices) |
1391.3 |
1496.0 |
1591.1 |
1654.9 |
1773.4 |
5.5% |
|
Energy Consumption (in MTOE) |
22.8 |
23.6 |
23.4 |
23.8 |
24.7 |
0.3% |
|
Energy Supply (in MTOE) |
38.3 |
38.9 |
40.6 |
39.5 |
40.7 |
0.4% |
|
Population (in million) |
87.0 |
88.6 |
90.5 |
92.2 |
94.0 |
2.0% |
|
Forex (in Pesos/USD) |
51.3 |
46.1 |
44.5 |
47.6 |
45.1 |
0.2% |
|
Average Crude Price (in USD/Barrel) |
61.5 |
68.4 |
93.6 |
61.7 |
78.0 |
11.6% |
*AAGR - Average Annual Growth Rate
|
INDICATOR |
2000 |
2001 |
2002 |
2003 |
2004 |
2005 |
|
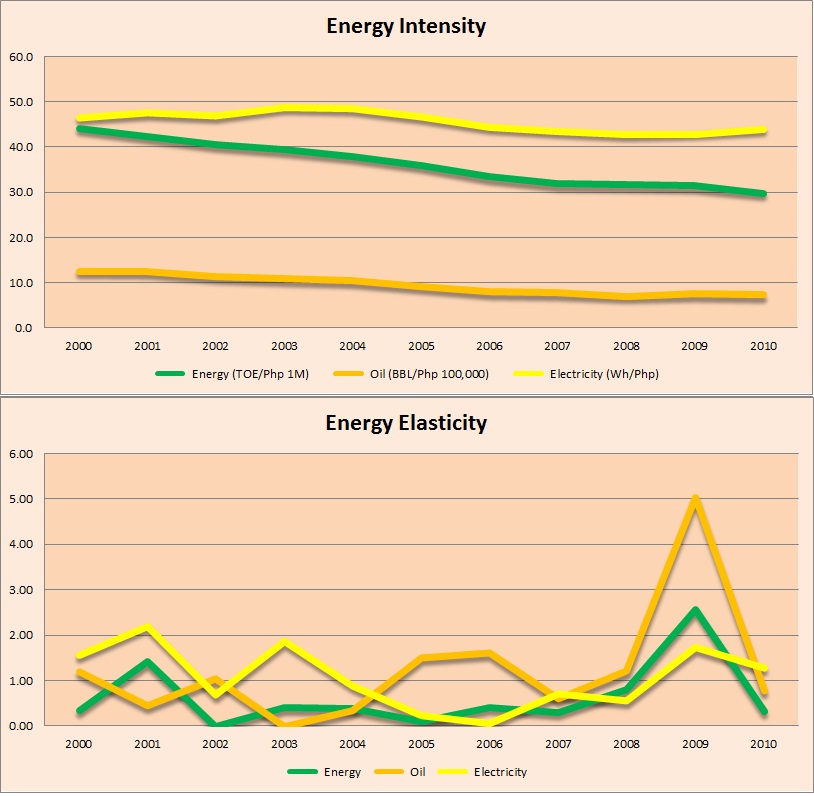
Intensity |
||||||
|
Energy to GDP** (TOE/Php 1M) |
44.09 |
42.24 |
40.42 |
39.30 |
37.87 |
35.89 |
|
Oil to GDP (BBL/Php 100,000) |
12.56 |
12.44 |
11.36 |
10.84 |
10.41 |
9.18 |
|
Electricity to GDP (Wh/Php) |
46.55 |
47.52 |
46.87 |
48.79 |
48.48 |
46.69 |
|
Elasticity |
||||||
|
Energy to GDP |
0.35 |
1.42 |
0.01 |
0.41 |
0.39 |
0.11 |
|
Oil to GDP |
1.20 |
0.45 |
1.04 |
0.01 |
0.34 |
1.51 |
|
Electricity to GDP |
1.56 |
2.21 |
0.68 |
1.87 |
0.89 |
0.22 |
|
Energy Per Capita (TOE/person) |
0.56 |
0.54 |
0.52 |
0.52 |
0.53 |
0.51 |
|
INDICATOR |
2006 |
2007 |
2008 |
2009 |
2010 |
AAGR* |
|
Intensity |
||||||
|
Energy to GDP** (TOE/Php 1M) |
33.31 |
31.80 |
31.58 |
31.32 |
29.88 |
-3.8% |
|
Oil to GDP (BBL/Php 100,000) |
7.97 |
7.76 |
7.15 |
7.49 |
7.28 |
-5.3% |
|
Electricity to GDP (Wh/Php) |
44.50 |
43.62 |
42.92 |
43.25 |
44.07 |
-0.5% |
|
Elasticity |
||||||
|
Energy to GDP |
0.42 |
0.31 |
0.80 |
2.58 |
0.33 |
-0.5% |
|
Oil to GDP |
1.61 |
0.60 |
1.21 |
5.05 |
0.78 |
-6.6% |
|
Electricity to GDP |
0.07 |
0.70 |
0.55 |
1.73 |
1.28 |
-2.0% |
|
Energy Per Capita (TOE/person) |
0.49 |
0.49 |
0.50 |
0.49 |
0.49 |
-1.4% |